The Coordinated Dollar
An Executive Brief on What Capital Can Do When It Is Never Interrupted
Living Asset Strategy series · The Coordinated Dollar · the Executive Brief — about a 20-minute read, one of four.
Built from “The Coordinated Dollar,” the full analysis. Every policy figure traces to one real carrier illustration, every property figure to one professional analysis, every market figure to the S&P 500’s own published returns.
The Trade You Are Already Making
Every dollar you own is making a trade right now, whether or not you chose it deliberately.
Money that grows is not safe. Money that is safe and reachable earns almost nothing. Money that is safe and earning something is locked up for a term. Growth, Safety, Access — the working assumption in nearly every plan is that you pick two and give up the third, and that the third one is the price of the first two.
Most wealth builders have simply accepted this. The brokerage account grows and cannot be touched in a bad year without selling at the wrong moment. The bank balance is reachable and earns nothing. The bond or CD ladder is safe, taxed annually, and locked for a term. Each piece is defensible. The plan as a whole quietly pays for the same dollar three different ways.
This brief is about the question underneath that arrangement: can one dollar hold all three at once? Not as a slogan — as a specification you can check, with figures that trace.
The answer turns out to have very little to do with rate of return, which is why the usual comparison misses it. It has to do with whether capital is ever interrupted — whether the dollar you deploy stops working in one place the moment it starts working in another. That single property, applied consistently, changes what a balance sheet does over thirty years far more than the difference between one investment's return and another's.
A Note on How the Numbers Are Handled
Every market figure here is a measurement, not a projection — drawn from the S&P 500's actual annual returns across its last full century and run through a single cash-flow engine. Every policy figure comes from one real carrier illustration for one real design, reproduced without adjustment. Every real-estate figure comes from one professional analysis of one representative property.
Where a number cannot be traced to one of those sources, it is not printed. Where a claim cannot be measured, it is stated as directional rather than dressed up as precise.
One disclosure belongs up front rather than in a footnote, because it runs against the case and is stated anyway. The policy figures in this brief assume the carrier's current dividend scale of 6.00%, which the illustration is required to hold flat for the life of the contract. That scale sits below 74% of its own thirty-eight-year history. The 5.00% Actual Net Return produced under it is therefore quoted near the floor of what the instrument has historically done, not the middle. The conclusions hold regardless — and they would only improve if the scale returned to its own historical average.
Three Seams Where Capital Leaks
Before naming any instrument, it is worth being precise about what is actually going wrong. The problem in most balance sheets is not a bad investment. It is three seams — places where money is lost not because a decision was wrong, but because no single decision was ever made about the whole.
Seam one: capital that earns nothing while it waits. Every wealth builder holds a reserve — call it the Opportunity Fund. It is the money that lets you move on an opportunity, cover a business shortfall, or survive a bad quarter without liquidating something you did not want to sell. The reserve is not a mistake; it is what makes everything else possible. But in most plans it sits in a bank account earning a fraction of a point, and it sits there for decades. The cost is not dramatic in any one year. Across twenty-five years it is one of the largest single leaks on the sheet — and it is invisible, because idle money never generates a statement showing what it failed to earn.
Seam two: no second source in an ordinary bad year. Not a crash — an ordinary loss. The market has a down year roughly one year in four. If income or a capital need arrives while the portfolio is down, and the portfolio is the only place to get it, you sell at the depressed price. The sale is not a mistake either; it is the only option the structure left. What matters is what happens the year after. A household with a second, uncorrelated source draws from that instead, and leaves the portfolio to recover on its full balance. A household without one sells again, at the reduced level, and locks the damage in.
Seam three: tax paid because nothing was located deliberately. Every dollar lives at a tax address — Taxable (also called non-qualified), Tax-Deferred, or Tax-Free. A pile ignores the addresses; it simply holds assets. A coordinated system decides which dollar grows where, which dollar funds a need first, and when the tax is paid — and when it is not. The pile pays whatever falls out of the structure it never designed.
None of these three appears on any single account statement, which is exactly why they persist. Each is a property of the arrangement, and no one is responsible for the arrangement. The investment advisor manages the portfolio. The CPA handles this year's return. The attorney structured a trust years ago. Each is good at their part. Nobody is designing for the total.
A Word About Rate, Before We Go Further
There is a companion analysis to this one, The Actual Net Return, which measures in detail the distance between what the market advertises and what an investor actually keeps. Its finding, briefly: across the 2001–2025 window, an advertised average of 10.32% became an Actual Net Return of 4.93% once volatility, activity, tax, and fees were applied to real dollars — and across all seventy-six rolling twenty-five-year windows in the last century, the typical window kept 6.40%, not the brochure's double digits.
That number matters here for one reason only: it is the honest benchmark. When this brief compares anything to "the market," it compares to what the market actually delivered to a real investor, not to the figure on the projection. The full derivation belongs to that paper and is not repeated here.
What follows is a different question. Not what did the market keep from you — but what else could this dollar be doing right now.
The Specification, Before the Name
Set the products aside and write down what the three seams actually require. A coordinated plan needs a position that:
- Earns while it waits — a meaningful contractual rate, so reserve capital is never idle.
- Does not fall when the market falls — so that in the year after a loss, a need can be met from it while the portfolio recovers.
- Is reachable on demand and grows Tax-Free — accessible without application, approval, or the possibility of being called, and reached in a way that is not a taxable event and does not raise the tax on Social Security or trigger Medicare surcharges.
- Keeps compounding while the capital is being used elsewhere — the same dollar working in two places at once.
- Settles the plan's protection and legacy obligations on the day they come due, whenever that is, income-tax-free to those who receive it.
Nothing in that list mentions insurance. It is a specification, and it is what the seams demand. Only one widely available instrument satisfies all five at once — and the tax treatment running through the list is not a footnote to it but a central part of what each job is worth.
The instrument is properly structured Whole Life insurance, held with a participating mutual insurer. This brief will not pretend that name arrives without baggage. It arrives with a great deal, most of it earned by policies sold badly. What follows is the case for the specification, and the evidence that one instrument meets it.
What "Properly Structured" Actually Means
This phrase carries the entire argument, and using it loosely would be the fastest way to lose a reader who then buys the wrong thing.
Whole Life can be designed along a dial. At one end, the design maximizes death benefit per dollar of premium — the conventional build, and the one most policies represent. At the other, it minimizes the base policy and pushes the maximum permissible premium into a paid-up additions rider, producing the greatest early cash value the tax code allows. Roughly a two-to-one ratio of rider face to base face keeps the contract under the line that would otherwise reclassify it as a Modified Endowment Contract and cost it its tax treatment.
The short version, portable to any conversation:
Properly structured means a minimized base policy with a maximized paid-up additions rider, funded right up to but under the tax line — which is not how most Whole Life is built.
Two things follow from that, and both belong in the open.
The design that serves the client best pays the advisor least. Agent compensation is driven almost entirely by base premium; a cash-maximized design pushes most of the premium into the additions rider, which pays a fraction of that. The gap is not small. In a recent case, the properly structured design paid the agent about 18.8% of what an all-base policy would have paid on identical premium — roughly eighty percent less. That misalignment is precisely why badly structured policies exist, and it is why a buyer who screens on structure before anything else is behaving rationally.
And structure is only the beginning. A policy built for this purpose is not a set-it-and-forget-it purchase. The premium-offset election has to be timed, the dividend option chosen deliberately, the funding kept in its proper range as the policy is used. None of this is difficult in the hands of someone who does it routinely — but it is not automatic, and it is not something a contract does by itself on a shelf. The instrument is not separable from the advisor who manages it. The first job is getting the design right. The second is keeping it well-run over time.
The Capitalization Period, Stated Honestly
The instrument has a real cost, and stating it plainly is the only way the rest of the analysis earns trust.
The reference case throughout this brief is Marcus, age 42, Preferred Plus Non-Tobacco, funding $12,000 a year into a properly structured contract with a participating mutual insurer. His initial total death benefit is $251,264 from day one.
Here is what the first years actually look like:
| Year | Cumulative premium paid | Same money in a bank | Policy cash value |
|---|---|---|---|
| 1 | $12,000 | $12,000 | $9,714 |
| 3 | $36,000 | $36,000 | $32,553 |
| 5 | $60,000 | $60,000 | $60,021 |
| 10 | $120,000 | $120,000 | $143,657 |
| 15 | $180,000 | $180,000 | $255,851 |
| 25 | $300,000 | $300,000 | $593,235 |
For roughly five years, the cash value trails the money. That is the honest cost of the structure, and no amount of framing removes it. What the bank column does not show is that from the first day, the policy also carries $251,264 of death benefit the bank account does not — so the comparison is never actually value-for-value.
By year five the position crosses over, and it never trails again. By year twenty-five, on $300,000 of premium, the contract holds $593,235 of cash value — and Marcus's out-of-pocket outlay stops there, met internally thereafter by the policy's own paid-up additions and dividends.
A wealth builder should read those first five years as a capitalization period, not a loss. It is the price of building a position that then does five jobs at once for the following forty years.
What the Cash Value Actually Replaces
Here is the comparison that gets made incorrectly almost every time, and getting it right is the difference between a serious analysis and a sales pitch.
Cash value is not a substitute for the growth sleeve of a portfolio. It does not compete with equities and this brief does not claim it does. It is a replacement for the safe money — the bond allocation, the certificates, the idle cash that every serious plan already holds and expects modest returns from.
So compare it to that.
So compare it there — on the safe sleeve every serious plan already holds. Take a $100,000 safe sleeve — $72,000 in bonds, $28,000 in cash — and measure what it actually keeps over twenty-five years, spelled out, nothing hidden inside a blended average:
| The safe sleeve, spelled out | Bonds · $72,000 | Cash · $28,000 |
|---|---|---|
| Gross rate | 5.4% | 3.0% |
| Less fund fee | −0.36% | — |
| Less income tax, every year | −25% of the gain | −25% of the gain |
| Net rate it actually keeps | 3.78% | 2.25% |
| After 25 years | $182,043 | $48,836 |
The bonds earn a fair 5.4%, but after the fund fee and the tax they owe every year they keep 3.78%; the cash keeps 2.25%. Together the sleeve grows to $230,879 — a blended 3.40% a year. Now hold that same $100,000 in the cash value of a properly structured contract instead — same safety, still reachable on demand, no fund fee and no annual tax:
| $100,000 safe sleeve · 25 years | Net rate | After 25 years |
|---|---|---|
| Bonds + cash, as typically held | 3.40% | $230,879 |
| Policy cash value | 5.00%, Tax-Free | $338,635 |
Same safety. Same access. $107,756 more.
Read the rates before the results, because that is the entire point. The bond's 5.4% is a headline rate — before its fund fee and before the income tax it owes every year — and what it actually keeps is 3.78%, while the policy's 5.00% is already net and Tax-Free. The bond yields more on paper and finishes far behind, not because the policy out-earned it — it did not — but because the bond is charged a fee and taxed every year as it works, and the cash value is not. Even with the entire sleeve in bonds and no idle cash at all, the most the safe money keeps is $252,838 — still $85,798 short of the policy's $338,635.
This reframes the entire instrument. The safe money in most plans is not underperforming because it was invested badly. It is underperforming because of where it is located. And the detail that makes it click: the dividend that funds the cash value is itself largely produced by a portfolio of high-grade bonds held inside the insurer's general account. You are not being offered an exotic alternative to bonds. You are being offered the same asset class, reached through a structure that does not tax it every year and does not lock it for a term.
What Do I Use It For?
Once a position like this exists, the practical question arrives immediately. It has a structured answer.
Every use of capital falls into one of three categories. Category 1 — consumptive: anything spent and gone, or that you would otherwise save up for. Category 2 — depreciating: assets that decline in value but still have to be bought. Category 3 — appreciating: investments expected to grow.
Categories 1 and 2 reduce to a single variable — what the money costs — and they deserve very little of a serious person's attention. The entire category's obsession with financing cars at a better rate is, honestly, what makes it look unsophisticated to anyone with a real balance sheet.
Category 3 is where a balance sheet actually changes. And there, a second question governs: which uses should get the capital first?
For that, a lending question is more useful than a wealth question — because when you deploy a policy loan you are acting as a lender, and a lender asks two things before releasing money. Does the use secure the loan? Does the use service it? Two questions, four answers, forming what we call the Capital Priority Ladder:
| Rung | Secures? | Services? | Risk you carry | Example |
|---|---|---|---|---|
| 4 — top | No | No | Highest | Speculative ventures; capital with a story and no cash flow |
| 3 | Yes | No | High | Raw land; an appreciating asset that pays nothing |
| 2 | No | Yes | Moderate | A revenue-producing expansion with no hard asset behind it |
| 1 — bottom | Yes | Yes | Lowest | Income real estate; an acquisition with existing cash flow |
| Foundation | — | — | None — contractual | Reserve capital and policy cash value, not yet deployed |
Read it as a ladder, because that is how the risk behaves: the higher you climb, the more of the repayment risk you personally carry. Rung one carries the least, because the deal itself repays and backs the loan. Rung four carries the most, because you do all of it.
The foundation is not a lesser thing than the rungs. Capital held in the policy and not yet deployed is the resting state — earning contractually, fully liquid, waiting. Getting its size right is what makes every deployment above it safe to make. A foundation built too thin turns ordinary opportunities into forced decisions.
Most of the value in this strategy is created on rungs one and two. Most of the noise in the marketing around this strategy is generated on rung four.
The Highest Use of Capital
Here the standard presentation of this concept makes an error worth correcting, because correcting it is what separates a rounding error from a strategy.
The usual demonstration proves that a 5.30% policy loan beats a 6% bank loan, and invites the prospect to feel clever about saving seven-tenths of a point financing a car. That optimizes a rounding error.
Put three numbers on the table instead: a bank loan at 6%, a policy net return around 5%, a policy loan rate of 5.30%. The canon says take the policy loan — it is cheaper, and the cash value keeps compounding behind it.
But suppose that same policy dollar could be deployed into something earning a realistic double-digit return. Then the correct move inverts the canon: take the more expensive 6% bank loan for the car, and preserve the policy capital for the higher use.
The question was never "what is the cheapest way to borrow?" It is "what is the highest use of this dollar?" — and once that becomes the governing question, the instrument stops being a financing trick and becomes a warehouse for capital awaiting deployment. Its job is to hold money productively, safely, and reachably until a use clears the bar, and then to fund that use without ever stopping its own compounding.
Which brings us to the exhibit that makes this concrete.
One Dollar, Two Jobs
Marcus finds a rental property: $360,000 purchase price, $378,000 all-in after costs, $3,300 a month in rent, held fifteen years, appreciating at 3% a year. One building. Three ways to buy it.
Every input is identical across the three scenarios — same property, same price, same rents, same expenses, same appreciation, same holding period. The only variable that changes is where the capital comes from.
| Scenario 1 All cash | Scenario 2 Bank loan | Scenario 3 Policy-loan funded | |
|---|---|---|---|
| Marcus's own capital in | $378,000 | $72,000 | $5,000 |
| Borrowed | — | $306,000 bank | $306,000 bank + $67,000 policy loan |
| Net annual ROR on invested capital | 7.28% | 14.84% | 29.09% |
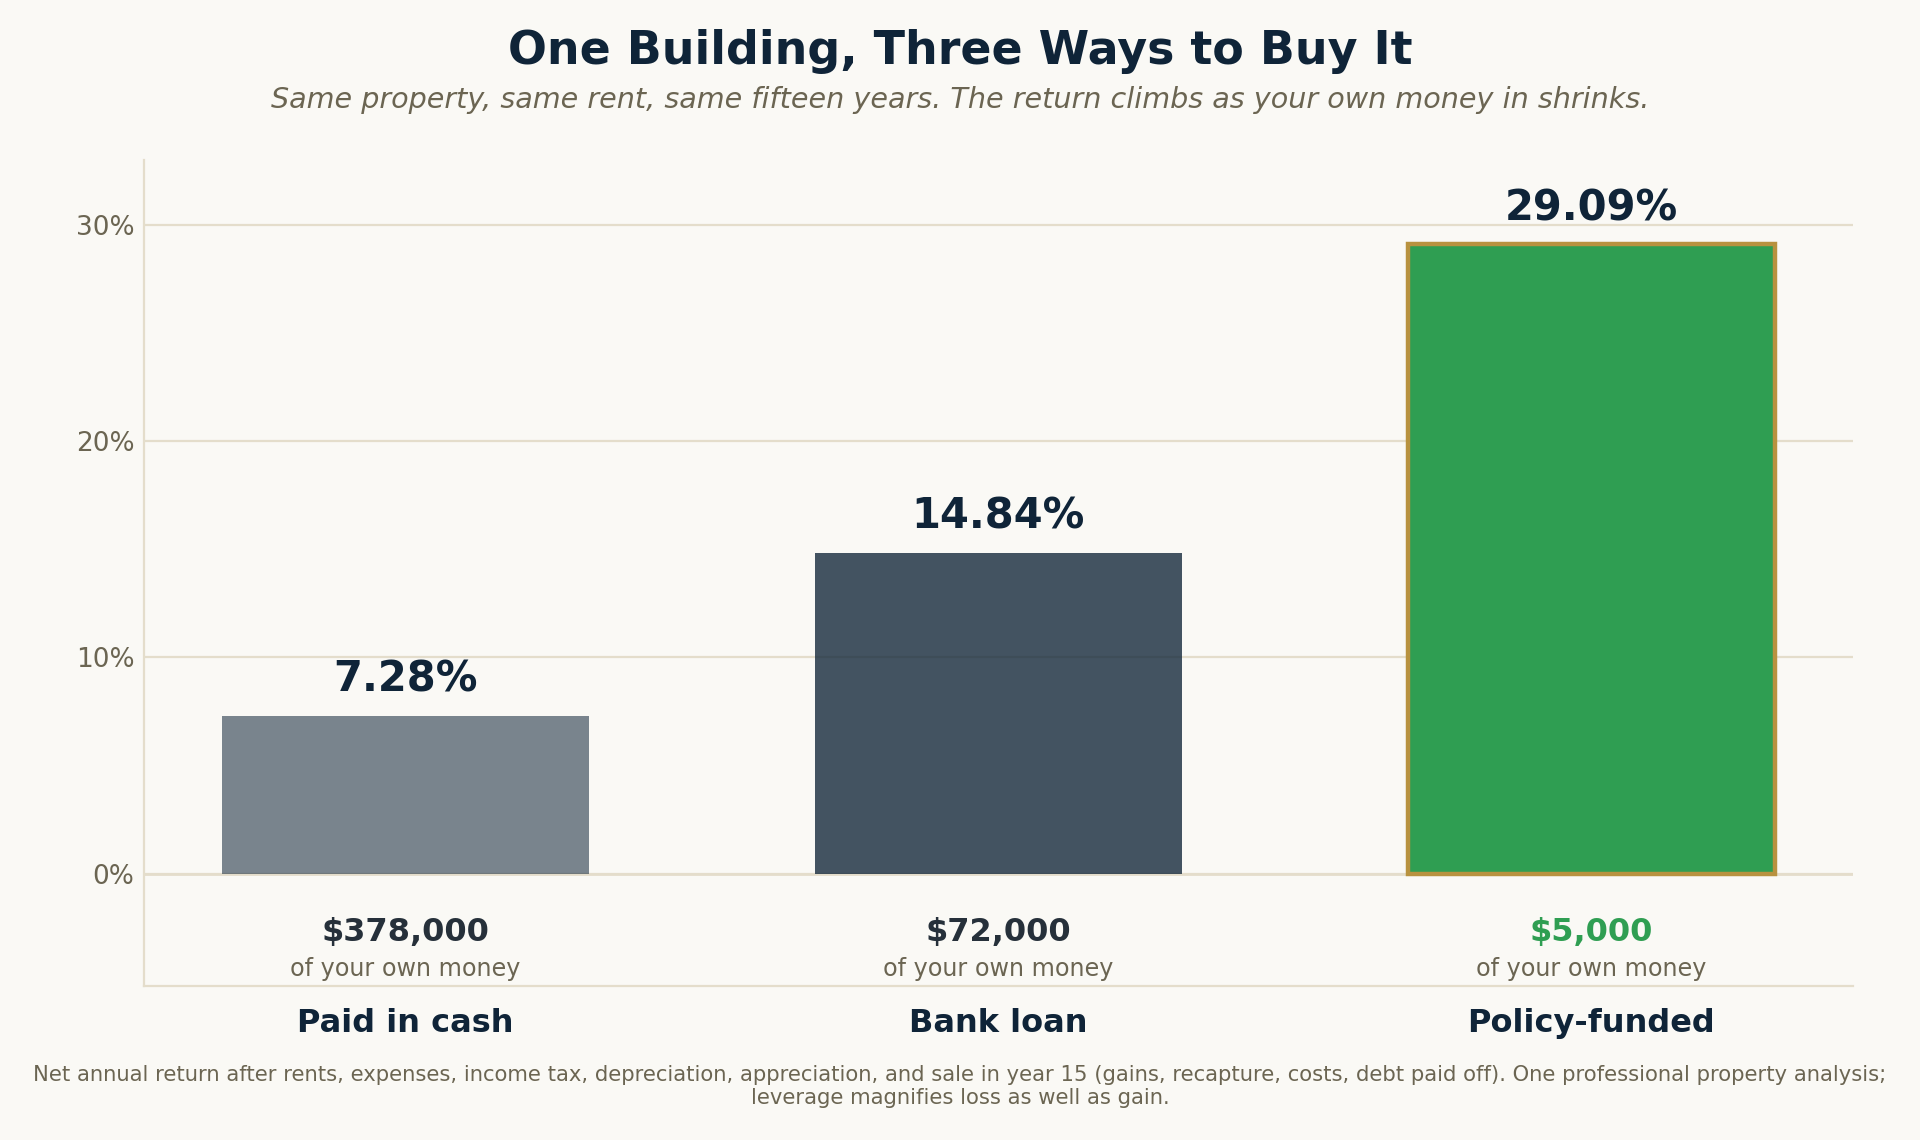
These are net annual rates of return on the investor's own capital — the compound annual return across the full fifteen years, after rents and operating expenses, after annual income tax on net rental income, after depreciation and the shelter it provides, with appreciation at three percent, and after the building is sold in year fifteen with capital gains, depreciation recapture, selling costs, and every remaining loan balance paid off. Nothing is excluded and nothing is added back.
The mechanism is not magic and deserves to be taken apart rather than admired.
Scenario 1 measures the building's own unlevered performance: 7.28% net annualized — a yearly rate across the full fifteen years, not a cumulative figure. That is the honest yardstick for the property itself, and every other scenario borrows against it.
Scenario 2 introduces the first positive spread. The bank's money costs less than 7.28%, so every borrowed dollar earns more than it costs, and the surplus accrues to the $72,000 that is actually Marcus's. The unlevered 7.28% becomes 14.84% a year, net, on his own capital.
Scenario 3 introduces the second. The policy loan costs 5.30% — comfortably below the 14.84% the leveraged position is now producing — so a second layer of positive spread stacks on the first, and it accrues to the $5,000 that remains his out of pocket. The unlevered 7.28% becomes 29.09% a year, net — annualized, not cumulative.
Now bring the policy back in, which is the part that matters most. The $67,000 that funded the down payment was borrowed against the cash value, not withdrawn from it. The money never left the policy. So while that $67,000 was doing its job as a down payment on a property returning 29.09%, it was simultaneously still a life-insurance asset — compounding, and carrying its death benefit.
The building's own rent repays the loan. By age 67 the contract holds $581,400 of cash value and $1,013,303 of net death benefit — while having served as the collateral that turned a $5,000 out-of-pocket commitment into a 29.09% return on a real property.
And it is worth being precise about who paid for the loan, because the honest version is more useful than the flattering one. Marcus paid his $12,000 a year, exactly as he would have anyway. The tenant retired the $67,000 loan — $94,354 all in with interest — without Marcus writing a single repayment check.
That is not the same as free, and it should not be described that way. The loan money came from the insurer's general account, not out of the cash value, and the interest was paid to the insurer. Carrying it costs the policy something real: at sixty-seven the contract holds $581,400 of cash value where it would have held $593,235 had he never borrowed. About $11,835 less, and $19,092 less death benefit. That is the price of the arrangement, and it belongs on the page.
What that $11,835 bought is a building that turned $5,000 of his own capital into a 29.09% net annual return, a loan a tenant paid off on his behalf, and a policy that never stopped compounding while all of it happened.
One dollar. Two jobs. Both traceable to the same illustration.
A caveat that makes the exhibit trustworthy: the three returns above come from a professional real-estate analysis carrying year-by-year amortization, depreciation and its tax shelter, income tax on net rental income, capital gains and depreciation recapture at disposition, and selling costs. This brief gives you every input that drives the conclusion and every output the model produced. It does not give you the model. What it does guarantee is the comparison — identical in every respect except the source of the capital.
Uninterrupted Capital Pays at Both Ends
There is a tendency to treat this as a strategy for the building years only — a tool for people with deals to fund. That understates it, and the reason is worth following.
The same property of the contract that produced 29.09% in deployment also governs what it does at the end of the asset's life. At 67, Marcus's contract converts to income at a 6.41% payout rate on its cash value, Tax-Free, paying $38,000 a year for twenty-five years — and still leaving $165,676 behind after every dollar borrowed along the way has been repaid. Across those years he takes $950,000 out of a contract he put $300,000 into, free of income tax, and it still pays a death benefit after the final payment.
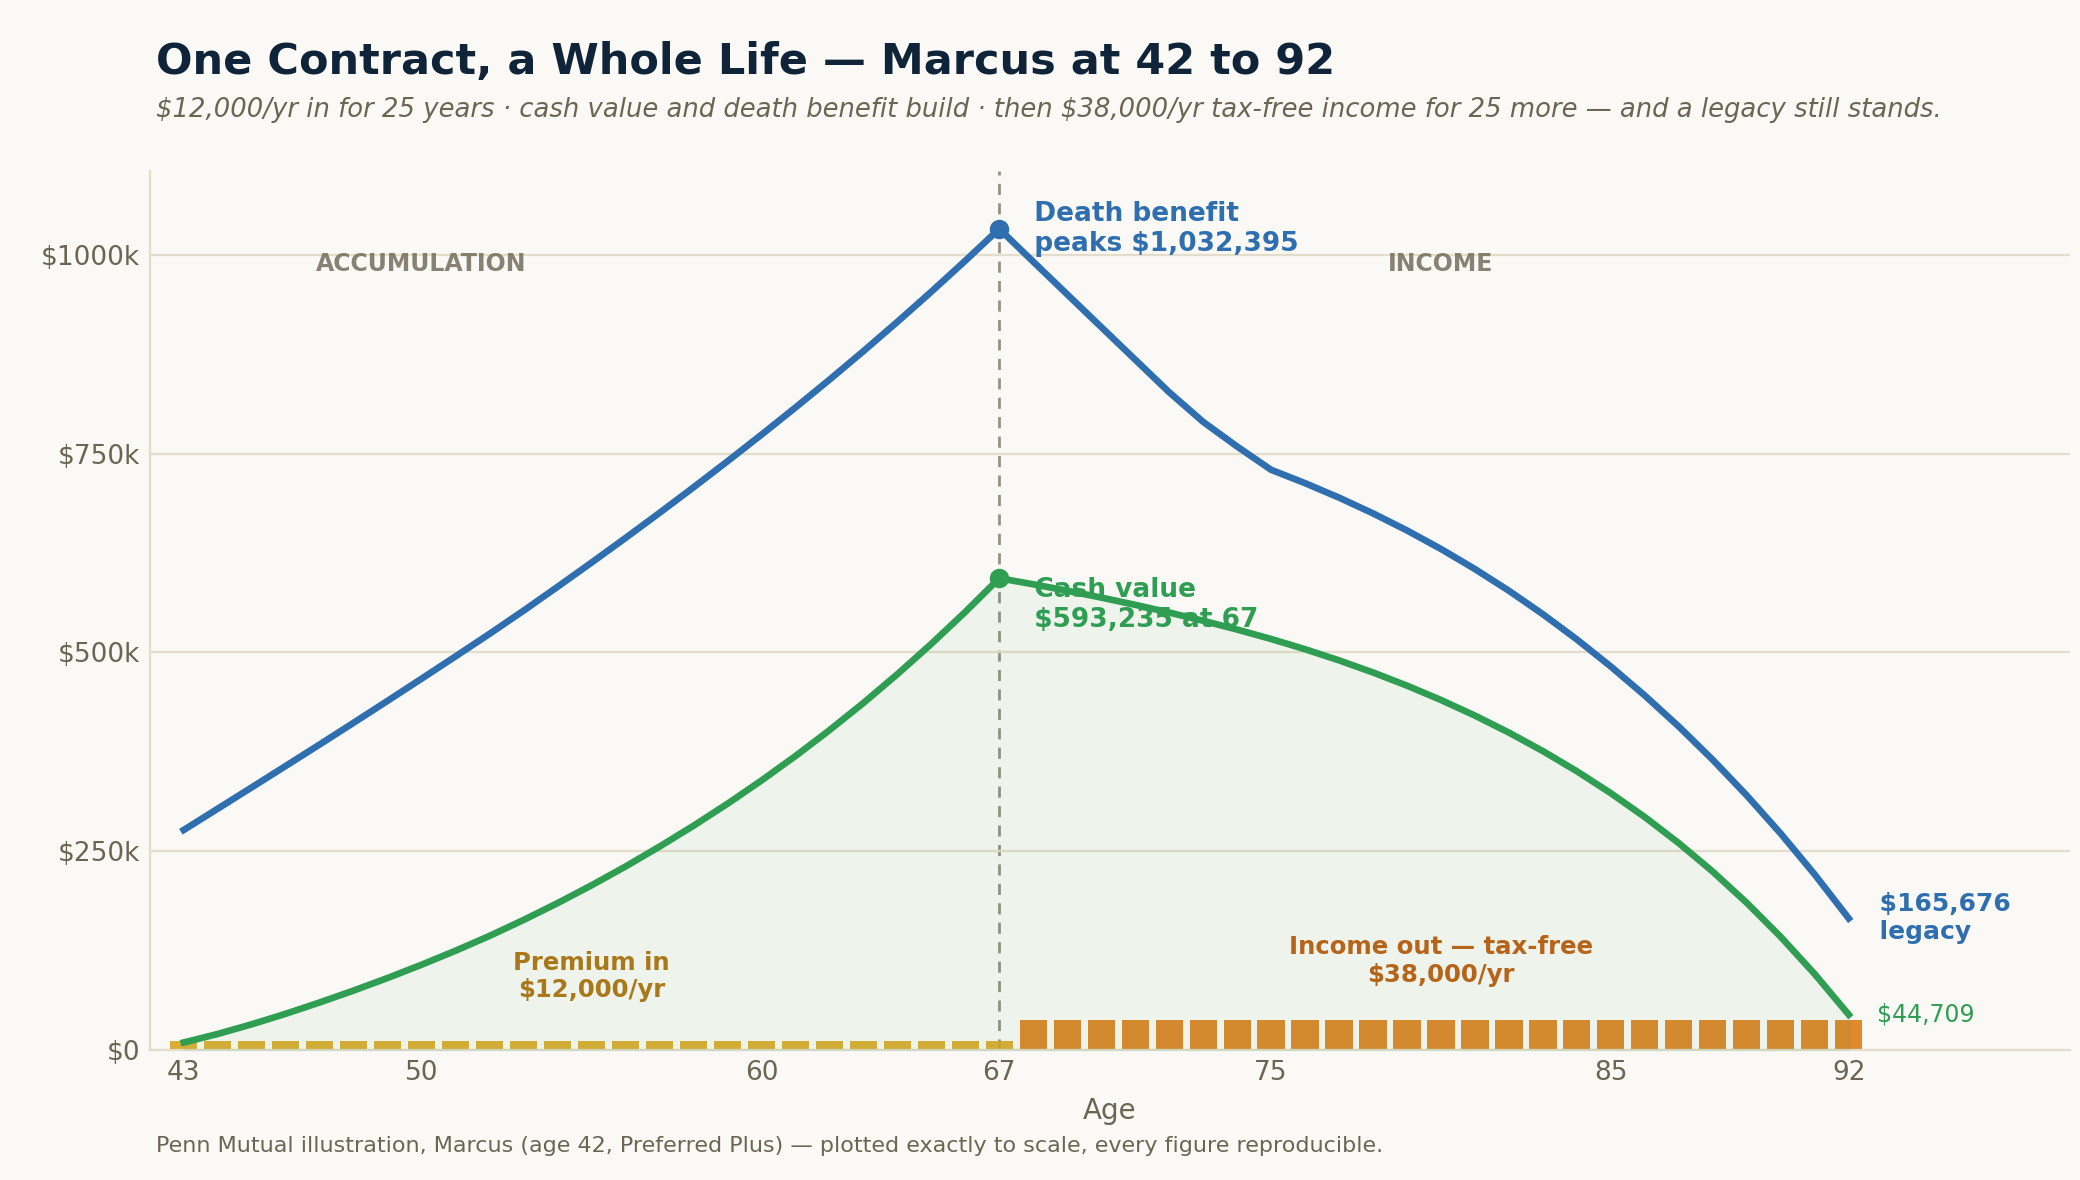
The 29.09% and the 6.41% come from the same property of the same contract: capital that was never interrupted.
That is the entire argument, and it pays at both ends of the asset's life.
Which is why comparing this instrument on accumulation rate alone measures the smaller thing. What a dollar is worth is not the rate it posts in the middle of its life. It is what it can do across the whole of it — deployed, borrowed against, converted to income, and passed on.
It is also why the buffer matters, and why it has to exist before it is needed. In a down year, income still comes from the portfolio — no one knows in advance how a year will end. It is the year after, once the loss is a fact, that income shifts to the cash value, leaving the portfolio to recover on its full balance rather than one that withdrawals have further reduced. Across the last century the longest unbroken run of down years was four; three to five years of buffer covers all of it. You cannot build that position after the bad year arrives. It exists at the start of the year that follows a loss, or it does not.
What the Usual Pitch Gets Wrong
The strongest reason to trust an analysis is that it corrects its own side first. Four claims are made routinely on this instrument's behalf, and all four are wrong.
"You borrow from yourself and pay the interest to yourself." You do not. You borrow from the insurance company, using your cash value as collateral, and the interest is paid to the insurer. What is true — and better — is that the full cash value continues compounding while the loan is outstanding. That is the actual mechanism, and it does not need embellishment. It is why this brief says borrow against, never borrow from.
"All your money is available immediately." It is not. Early years carry real capitalization cost, as the table above showed plainly.
"It's a better investment than the market." That is the wrong contest and this brief does not enter it. The comparison that matters is against the safe money a plan already holds — where, as shown, a lower headline rate still finishes far ahead on fee, tax, and structure.
"It replaces your portfolio." It does not, and the analysis is stronger for saying so. It replaces the bond sleeve and the idle reserve, and it coordinates with everything else.
One more, from the other direction, and it is the most honest thing in this brief: the calculation that measures a household's true protection need — Human Life Value — frequently produces a number so large that the correct answer is term insurance, not more Whole Life. For a healthy 42-year-old, twenty-year level term covering roughly $546,000 costs about $452 a year. A serious analysis follows that number where it goes. The same coverage purchased at 62 costs about $3,497 — nearly eight times as much — which is the actual argument for acting earlier, and it has nothing to do with the product being sold.
What This Brief Is Not Arguing
It is not arguing that markets have no place in a plan. They have a central one.
It is not arguing that this instrument out-earns equities. That is the wrong test, and refusing the test is not the same as losing it.
It is not arguing that everyone should own one. Some households will not consider Whole Life; some cannot qualify. For them the plan still coordinates what they will hold — an income floor built with an annuity, a buffer approximated with reserves or a certificate ladder, a legacy handled through existing assets and structure. More moving parts, sometimes less efficient, and categorically better than the uncoordinated arrangement they arrived with.
What it is arguing is narrower and, I think, more durable: lifetime outcomes are decided less by the quality of any single piece than by how well the pieces are coordinated into one system. One dollar that earns while it waits, does not fall when the market falls, stays reachable, keeps compounding while deployed, and settles the legacy on time — that dollar does work that five separate dollars cannot. The instrument is the conclusion the specification points to, and the conclusion is stated with conviction rather than sold.
Where to Begin
If you want the full derivation — the traced ledgers, the three-scenario property model, the year-by-year figures, the anticipated critiques answered in full — that is the deep analysis this brief is drawn from: The Living Asset Strategy: The Coordinated Dollar.
If you would rather start with your own numbers, that is a Capital Coordination Session: a focused look at how your capital is actually arranged — whether your reserve, your deployments, your tax exposure, and your legacy are working as one system or simply sitting side by side. You leave knowing where your seams are, whether or not you do anything about them. What it produces is a coordinated Retirement Income Plan — principles first, then strategy, then whatever instruments the plan actually calls for, with one person designing for the total.
Certainty · Liquidity · Legacy