The Number Wall Street Shows You Is Not the Number You Will Retire On
The gap between what the market advertises and what you actually keep — the short version.
Accumulation series · The Actual Net Return · the Highlights — about a 7-minute read, one of four.
Built from “The Actual Net Return,” the full analysis. Every figure below is reproducible from the market’s own published returns.
Across 2001 through 2025 — the quarter-century most of today's savers have been investing through — the S&P 500 averaged 10.32% a year.
On a $100,000 account, a real investor kept $332,750 of it after twenty-five years. That is an annual return of 4.93%.
Both are true. Both come from the same market, the same years. One is the number on the brochure. The other is the number you retire on. Everything below is the story of the distance between them — and, once it's on the table, the one structural fix that closes it.
The Four Forces That Close the Gap
Your retirement projection is almost always built on one number — a flat average return. Four forces, working on every dollar every year, stand between that number and the one you keep. Together they are the Four Forces of Return Compression.
A loss costs more than the next gain returns. A 37% loss followed by a 37% gain doesn't break even — it leaves you well behind. Averaging the ups and downs gives one figure; living through them gives a smaller one. Across the century this Volatility Drag cost 1.83 percentage points a year.
Funds quietly trail the index — even if you never mistime a thing. Most retirement money sits in actively managed funds, and roughly nine in ten of them lose to the index they're measured against. That isn't your fault; it's the record of the management you were placed in. This is Activity Drag.
A taxed dollar is one that never compounds again. In a traditional 401(k) or IRA, every withdrawn dollar is taxed as ordinary income — not just the growth, the entire balance. At 25%, a quarter of your statement was never yours to spend. This is Tax Drag.
A percentage charged every year, on your whole balance. Fee Drag is the smallest of the four — and the only one you actually choose. Most people never see what they truly pay, because fees come in layers, most of them off the statement. On a single $100,000 account over a working life, the full one-percent load — what you actually pay, measured against paying nothing — works out to about $135,000 of your own money, gone a slice at a time.
What the Math Actually Shows
Watch the market's own advertised average fall through the four forces, on the 2001–2025 window:
| Stage | $100K over 25 years |
|---|---|
| Average Gross — what Wall Street projects (10.32%) | $1,164,870 |
| After Volatility Drag | $812,153 |
| After Activity Drag and a realistic 1% fee | $443,667 |
| After 25% tax — the Actual Net (4.93%) | $332,750 |
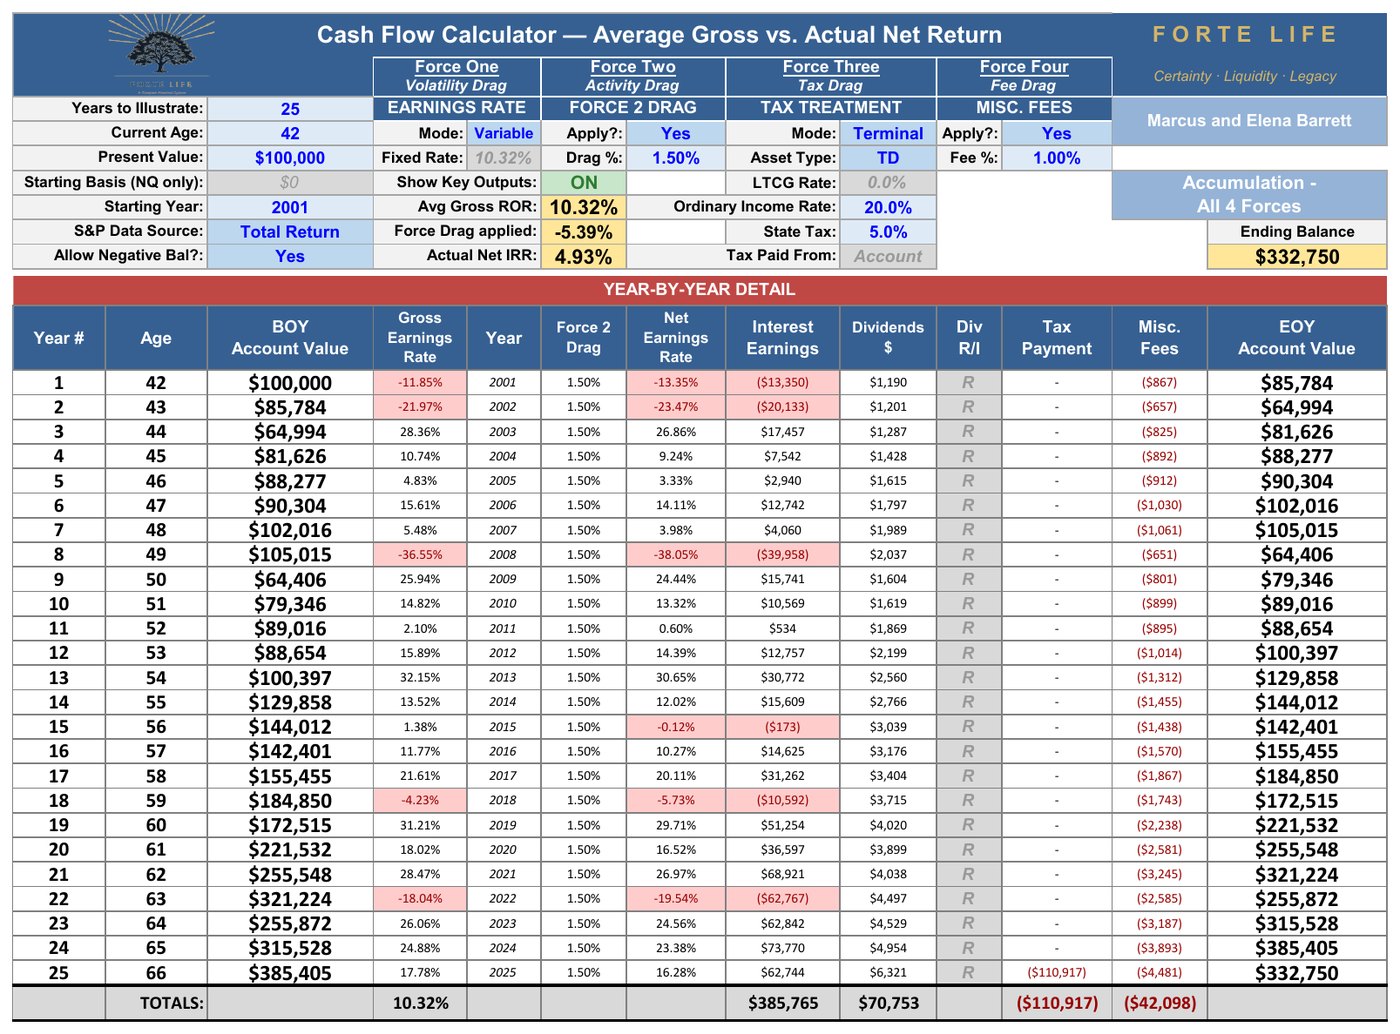
And this was not a bad stretch. Twenty of the twenty-five years finished positive. The compression isn't caused by the crashes — it's four forces working on every year. Nor was it a cherry-picked window: run all seventy-six twenty-five-year windows in the last century, and the gap appears in every single one. The typical window kept 6.4% — that median, not the brochure's 10%, is the honest number to plan against.
What This Actually Is
Growth rate is what the whole industry measures. It is also only half of retirement — and the smaller half. Money isn't saved to be a number; it's saved to become income, and what's left becomes legacy. That second half needs an instrument to carry it — and it's time to name the one this whole case points to, plainly.
It is a properly structured whole life policy, held with a participating mutual insurer.
The two words that carry the weight are properly structured — because most whole life is not built this way, and that difference is the entire reason the numbers above are possible. If you've ever heard whole life criticized, the criticism was aimed at the ordinary design: a policy built to maximize commission and death benefit, sold to someone who was never shown the arithmetic. This is the opposite of that — a minimized base policy with a maximized paid-up-additions rider, funded right up to but under the tax line.
There's a reason the right design is rare, and it doesn't flatter my own profession: the design that serves the client best pays the advisor least. In a recent case, the properly structured version paid the agent about 18.8% of what a conventionally built policy would have paid on identical premium — roughly eighty percent less. That's precisely why badly built policies exist, and why asking how a policy is designed, before anything else, is the rational move.
The Smaller Pile That Paid More
Now look at the ending. Two retirees at sixty-seven, from the same starting place. One holds $1,000,000 in a 401(k) — $750,000 after the 25% tax waiting on it. The other holds $593,235 of cash value in a properly structured policy — about twenty percent less money.
The 401(k) draws $48,000 a year; after tax, $36,000 reaches the checking account, and run through the real 2001–2025 market it runs dry in the twenty-fourth year — at ninety, it's gone. The policyholder, starting with less, draws $38,000 a year, tax-free — more in the pocket, every year, for all twenty-five. It never runs dry. And at ninety-two it still leaves $165,676 behind.
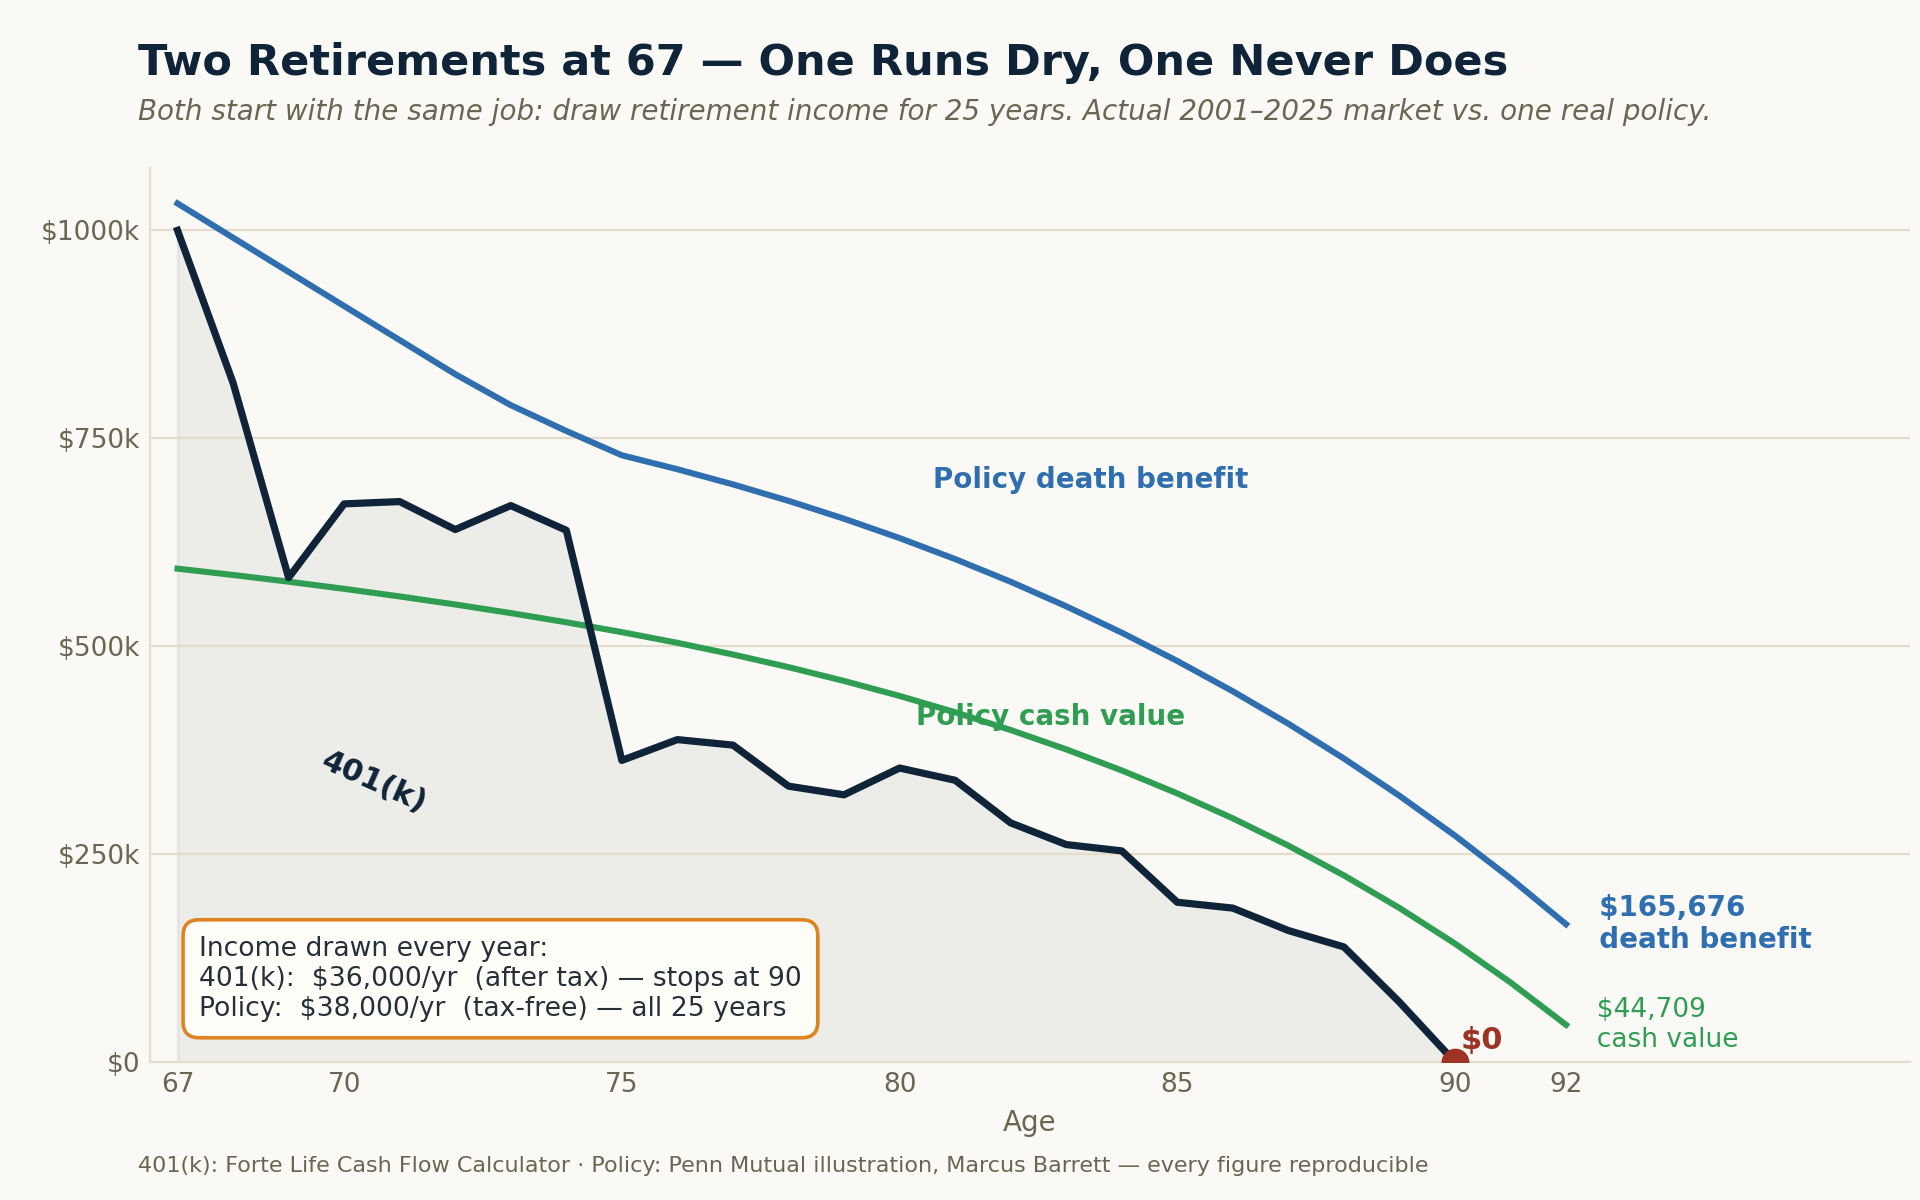
The navy line is the 401(k) — it hits zero at ninety. The policy's cash value (green) and death benefit (blue) never do, and it pays more, tax-free, the whole way.
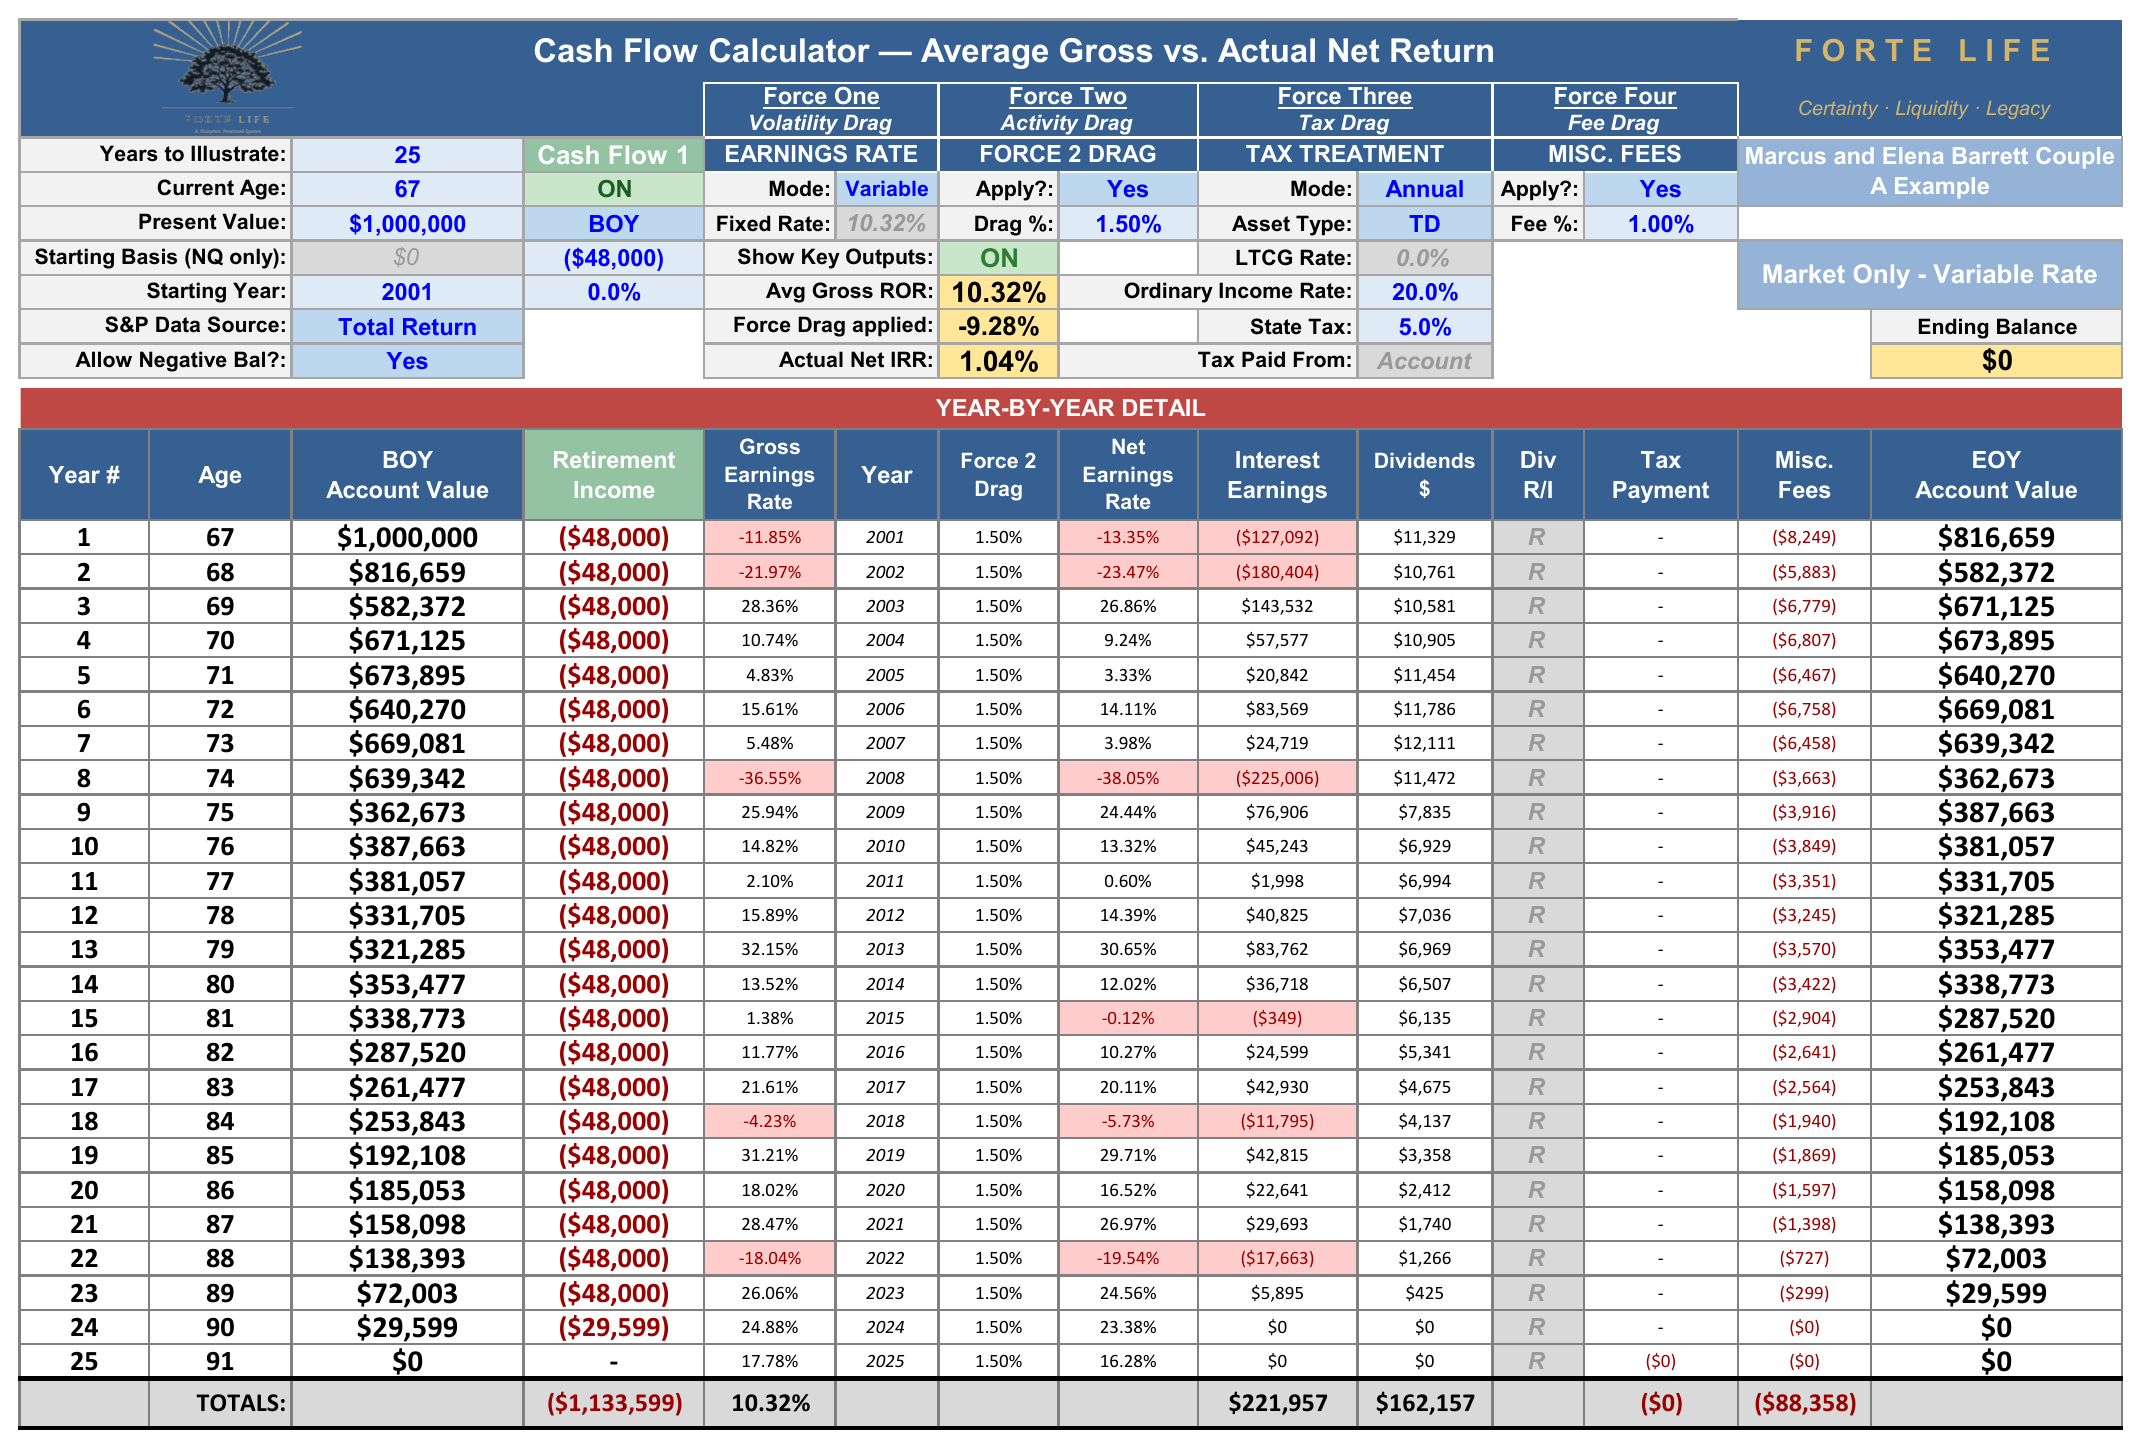
The smaller pile delivered more spendable income, for more years, and left a legacy the larger one couldn't.
The market has to earn a great deal more, because it keeps a great deal less.
The Safe Money You Already Hold
That was the whole nest egg. The same mistake sits, quietly, in the safe money — the bonds and cash every sound plan already holds. You may not think of yourself as a bond owner, but a real slice of your portfolio is already there on purpose — for someone in their forties, roughly a quarter of everything.
Put $100,000 of it the ordinary way — bonds and cash — and after the fund fee and the income tax it owes every year, it grows to about $230,879 over twenty-five years. Hold that same $100,000 in a properly structured policy's cash value instead — same safety, still reachable on demand — and it grows to $338,635, tax-free.
Same safety, same access, $107,756 more.
Read it net to net, because that's where the "but whole life earns less" reflex breaks: the bond's headline 5.4% keeps only 3.78% after its fee and the tax it owes every year, while the policy's 5.00% is already net, and tax-free. One detail makes it click — the dividend funding that cash value is itself produced largely by high-grade bonds inside the insurer's own account. It's the same kind of asset, in a place that isn't taxed every year and isn't locked for a term. The safe money in most plans isn't underperforming because it was invested badly. It's underperforming because of where it's located.
(What that same dollar can do once it's put to work — borrowed against while it keeps compounding — is the subject of the companion Living Asset Strategy analysis.)
Where to Begin
Read the full story → Article — The Two Retirements. The complete article walks through the gap with real numbers and the two retirements told side by side — a few minutes, and the clearest version of the case.
Or start with your own numbers → book a Capital Coordination Session. A focused look at how your money is actually put together — whether your accumulation, your income, your taxes, and your legacy are working as one system or just sitting side by side. You get something of value whether or not you buy anything: you leave knowing where the seams are. What it produces is a coordinated Retirement Income Plan — principles first, then strategy, then whatever instruments the plan actually calls for, with one person designing for the total.