The Order of Things
An Executive Brief on Why the Order of Returns — Not the Average — Decides Whether a Retirement Lasts
Distribution series · The Order of Things · the Executive Brief — about a 20-minute read, one of four layers.
Three Numbers, One Market
The market of 2001 through 2025 was not a bad market. It averaged 10.32% a year, and twenty of its twenty-five years were positive. It is the honest example precisely because it was a good quarter-century, not a rigged one. And yet the same twenty-five years produced three completely different numbers, depending only on who you were while they happened.
If you were the index, you earned that 10.32%. If you were a saver — contributing, deferring, never selling — you kept a compound 4.93% of it after the four ordinary forces of return drag (volatility, active-management underperformance, tax, and fees) each took a turn; across the last century's windows the saver's median is 6.40%. But if you were a retiree drawing income through that same market — a couple at sixty-seven with $1,000,000, taking $48,000 a year — you kept 1.04%, and your account was empty at ninety.
Same market. Same average. Three numbers, and the gap between the saver's 4.93% and the retiree's 1.04% is the entire subject of this brief. It is not a weak-market story — the market was fine. It is an order story: the same returns, delivered in the sequence they actually came, are survivable while you are building and decisive once you are drawing. This is sequence-of-returns risk, and it is the single most consequential force in the distribution phase — and the one almost no market-only plan is built to withstand.
A Note on How the Numbers Are Handled
This brief presents the core findings of a longer whitepaper on the same subject, condensed to be read in about twenty minutes. Two disciplines hold throughout. First, every figure is traced, not argued — each market figure is the actual output of a cash-flow calculator run against the real S&P 500 total return, each policy and annuity figure the actual carrier illustration, quoted nearer a floor than a ceiling; nothing is retyped into a flattering summary. Second, the comparison is always whole plan against whole plan — never a contest of one sleeve's rate against another's. A retirement is not a rate. It is a system that has to deliver income while you live and leave something when you go, and that is how it is scored here. The full derivation — every year-by-year ledger, the hundred-year record, the objections answered at length — is in the whitepaper this brief is drawn from.
The Reversal
Here is the fact the whole distribution phase turns on, and it is one most savers are never told changes.
While you are saving, the order in which good and bad years arrive does not matter. Reorder any quarter-century's returns however you like — put the crash first, put it last, shuffle it — and the ending balance does not move by a dollar, because the balance is simply the product of the annual factors and multiplication does not care about order. Take $100,000 through three years of up 25%, down 10%, up 15% and you have $129,375. Run those same three years in any other order and you still have $129,375. That is why the industry is comfortable quoting averages to savers: for a saver, the average is genuinely enough.
The day you begin drawing income, that protection expires. Now every bad year arrives while money is being removed, and the dollars taken out at the bottom are gone before the recovery can reach them. The same range of futures that was survivable while building becomes decisive while spending. Order stops being irrelevant and becomes the dominant variable — more consequential than the average return, more than the withdrawal rate, more than the size of the account. Time, which was the saver's greatest ally, becomes the retiree's constraint. Every climber knows the summit is only half the trip, and not the dangerous half — the descent is where the accidents happen, when the legs are tired and gravity is finally at your back. Accumulation is the climb up; distribution is the climb down: the same mountain, but the half where a misstep actually costs you, and it asks for different muscles and different tools than the way up. A plan built for the ascent and handed over unchanged is not a plan for the descent at all.
The Ordinary Year
The mechanism does not require a crash to do its damage. It only requires an ordinary bad year at the wrong time, and the arithmetic is worth seeing before any of the larger numbers, because everything else follows from it.
A portfolio falls 15% — an unremarkable year, one the market delivers routinely. To climb back to where it started, it does not need 15%; it needs about 17.6%, because the gain now works on a smaller base. That much is true for saver and retiree alike. But the retiree has also withdrawn that year — say 5% for income — so the account did not fall 15%, it fell closer to 20%, and the recovery it now needs is not 17.6% but roughly 24.7%. The withdrawal converted an ordinary down year into a hole nearly a quarter deep, dug at the exact moment the account could least afford it. Do that in the first years of retirement and the account never fully recovers; it funds a rising share of the same fixed income out of a shrinking base until there is nothing left to draw from. No crash is required. The order did it.
The Retiree's Number
Put real numbers on it. A couple retires at sixty-seven with $1,000,000 and draws $48,000 a year — a 4.8% withdrawal, squarely within the range the industry has long called safe. Run that against the real 2001–2025 sequence, with the ordinary forces of drag applied, and the account pays twenty-three full years, a partial twenty-fourth, and then stops: empty at age ninety, having paid out $1,133,599 in income and $88,358 in fees along the way. The internal rate of return on the whole run — a million dollars in, that income out, nothing left — is 1.04%.
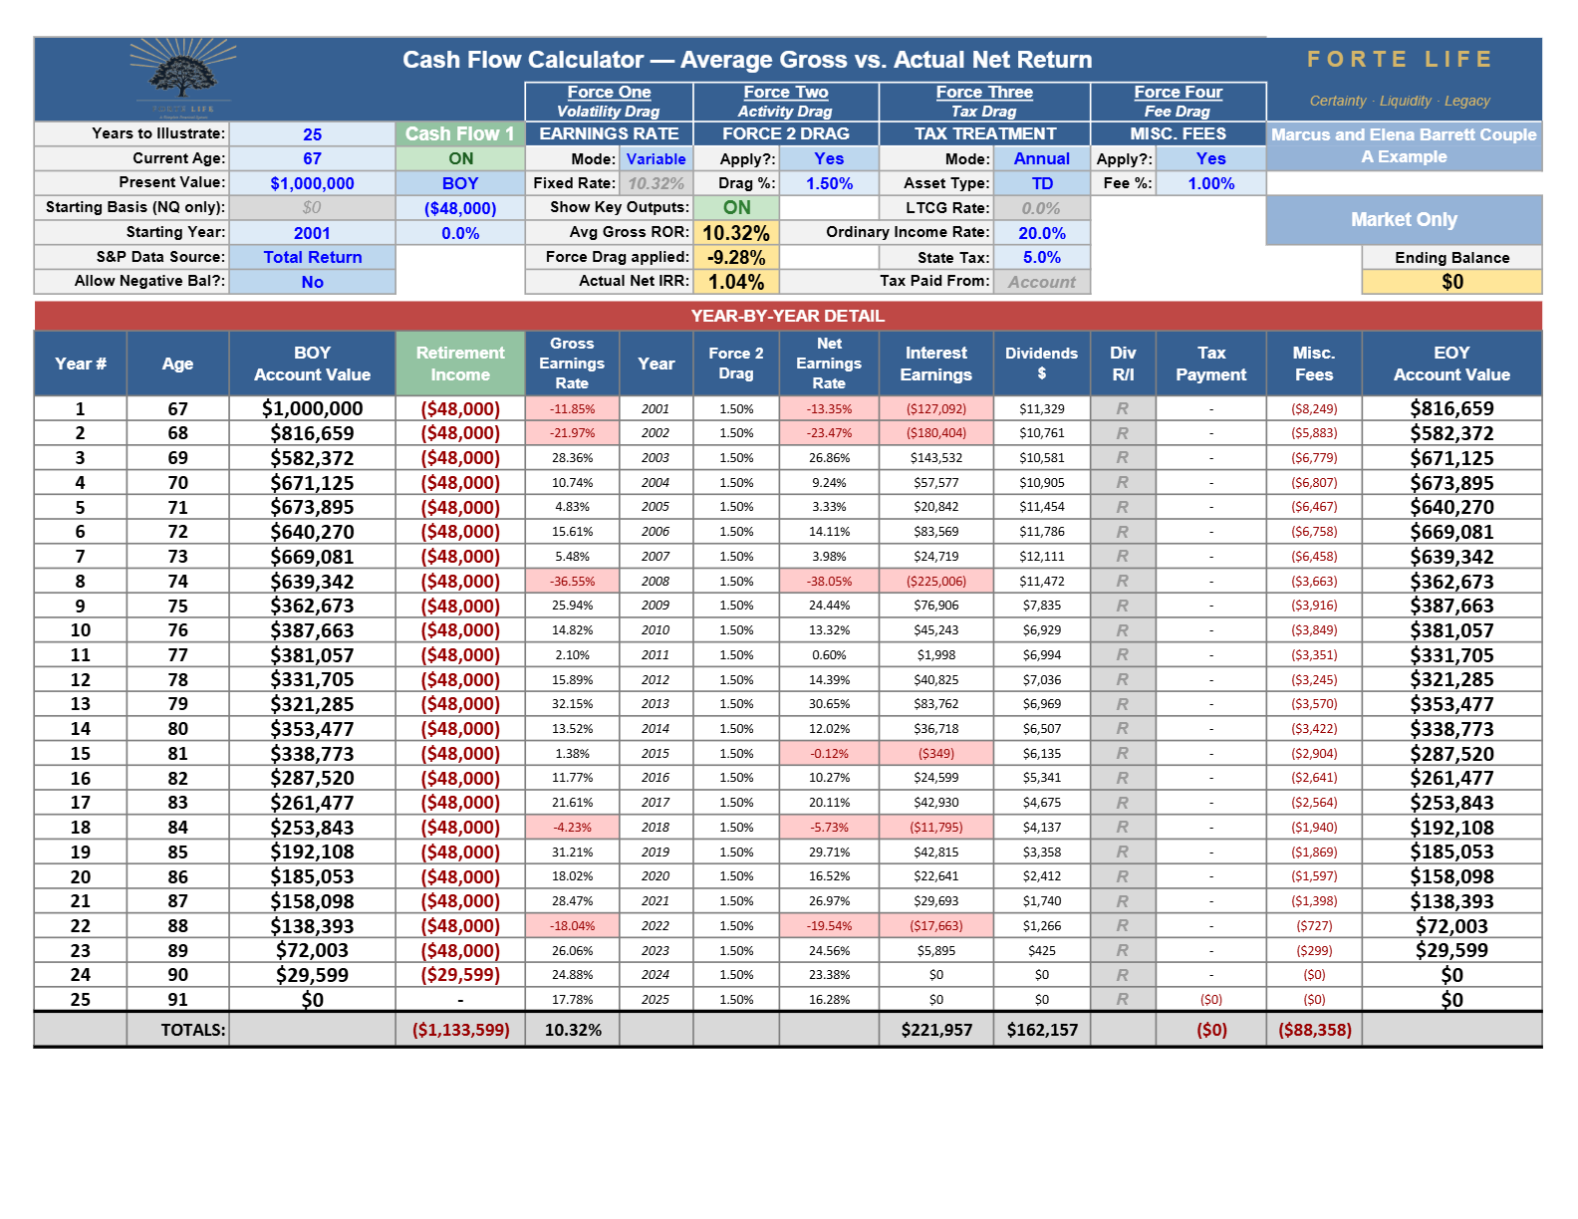
That is the number. Not because the market was cruel — it averaged 10.32% — but because the withdrawals met the losses in the wrong order. The couple did nothing wrong. They drew a reasonable income from a reasonable balance in a good market, and the order emptied the account while they were still alive to need it.
It Was Not the Window, the Model, or the Draw Rate
Three objections arrive immediately, and each fails on the record.
"You picked a bad window." The opposite: 2001–2025 averaged 10.32% and was a good quarter-century. Run the same $1,000,000 household — $48,000 a year — from every notorious retiree start-year and the record is stark. In three of six, the market-only plan failed: the income stopped while the couple was still alive.
| Retiree start-year | Market-only: income delivered → legacy | Firewall: income → legacy |
|---|---|---|
| 1929 — Depression | $540,146, stopped at 78 → $0 | $1,200,000 → $505,071 |
| 2000 — dot-com | $833,781, stopped at 84 → $0 | $1,200,000 → $899,565 |
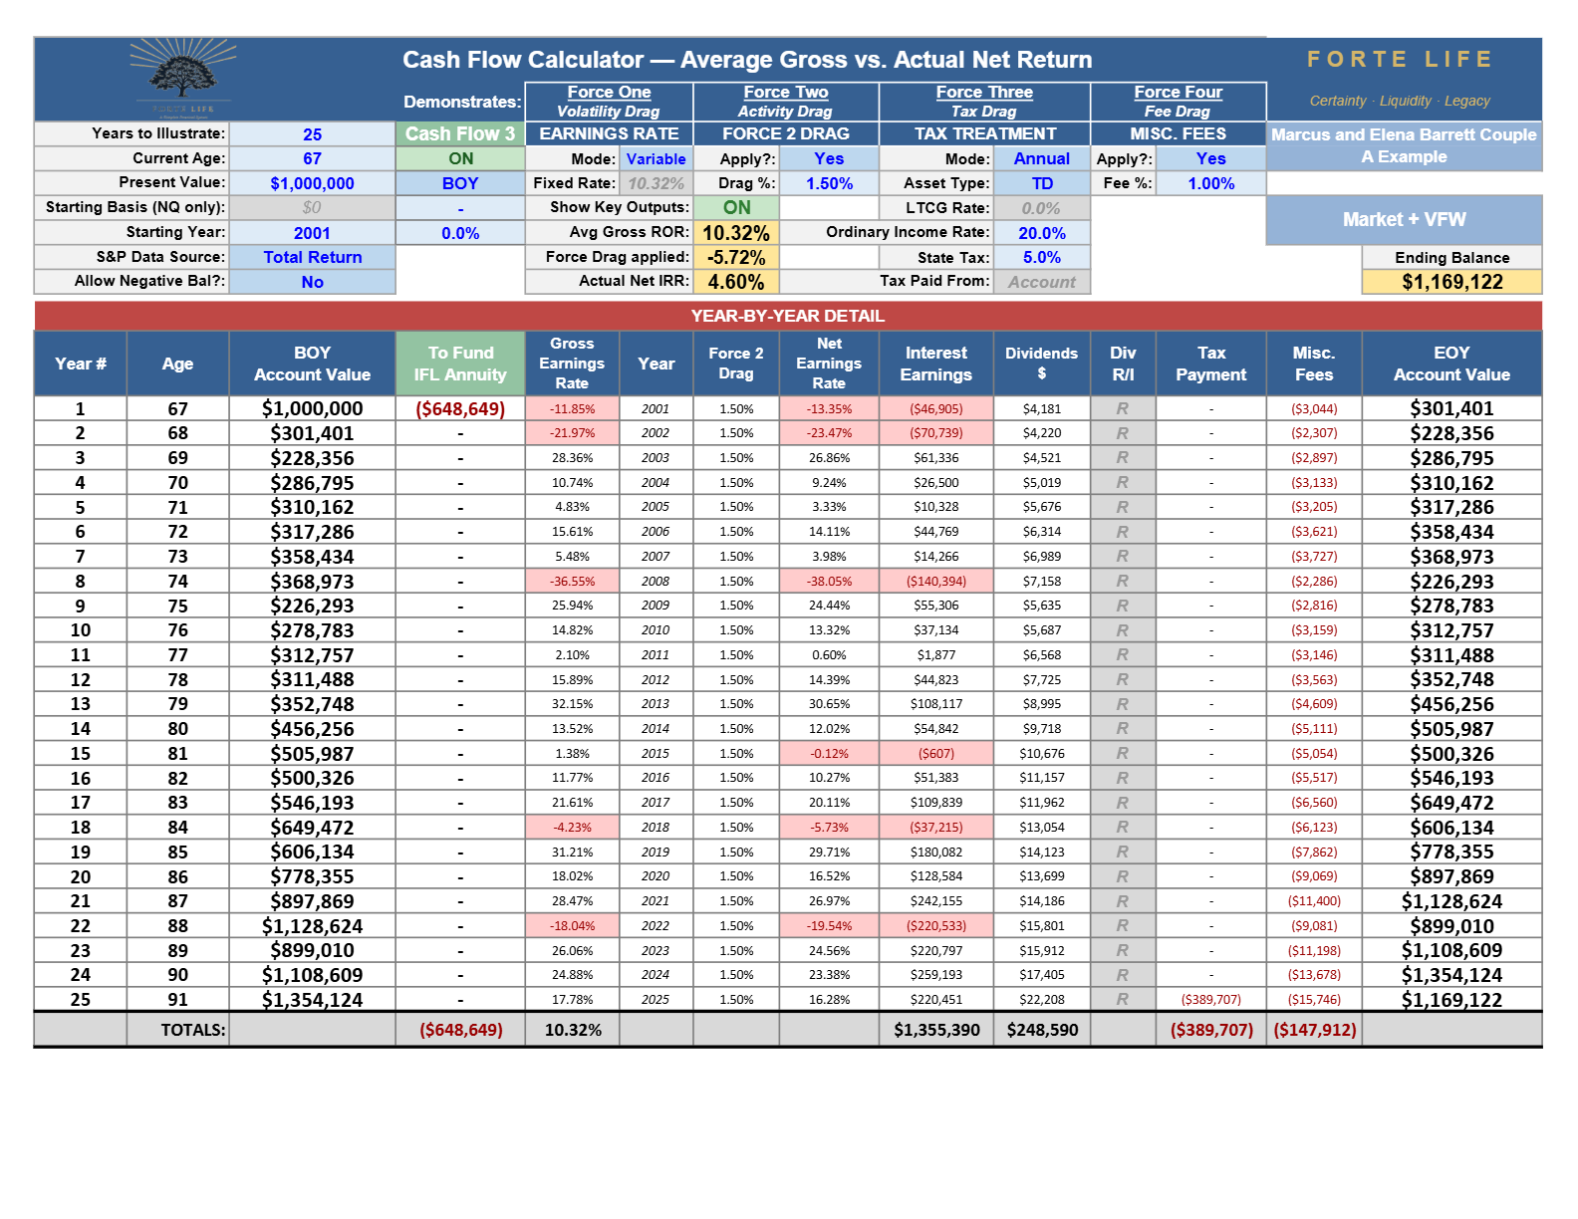
| 2001 — the window above | $1,133,599, stopped at 90 → $0 | $1,200,000 → $1,169,122 |
| 2007 — financial crisis | $1,200,000, survived → $749,483 | $1,200,000 → $1,127,838 |
| 1966 — stagflation | $1,200,000, survived → $658,787 | $1,200,000 → $1,396,991 |
| 1973 — oil shock | $1,200,000, survived → $2,254,159 | $1,200,000 → $3,099,539 |
The Firewall plan delivered its full income and left a legacy in all six — including the three where the market-only plan happened to survive on its own. Among the hard starts, the market-only plan is roughly a coin flip; the Firewall's floor is 100% by construction, because no market sequence can reach a contractual guarantee.
And six is not the whole record. Run the same household through all seventy-six rolling 25-year windows the last century offers — every start-year from 1926 to 2001, nothing chosen — and the picture only hardens. The market-only plan ran its income dry while the household was still alive in seven of the seventy-six — one retirement in eleven, with no way to know in advance which draws the short straw. The Firewall failed in none. And the Buffer, tested with and without across all seventy-six, improved the market sleeve in every one of them, because not selling into a recovery is an edge that compounds in every history the market has produced. The industry's answer to that seven-in-seventy-six is a Monte Carlo simulation and a prescription to spend less — self-insurance through under-spending. The coordinated plan does not trade income for a probability; it removes the failure from the floor by contract, and pays more income while doing it. The aim is not to predict the weather ahead — it is to install the pieces that shrink the range of outcomes and raise the odds of arriving, whatever actually comes.
There is a plainer way to see the whole choice. Think of retirement as a drive across the country. If raw speed were all that mattered you would take a racing motorcycle — nothing is faster. But no one crosses a continent on one, because the trip is not a sprint: it runs through weather you cannot time, it has to carry your family, and above all it has to arrive. A market-only plan is the motorcycle — quicker on the clear, dry stretches, and it will sometimes finish richer. The coordinated plan is the car: a little off the top end, and in exchange a windshield, seatbelts, and room for everyone, built to finish the trip in whatever weather is waiting. No one rides the bike across the country because it is faster — and no one should cross thirty years of retirement on growth alone because, in the sunshine, it sometimes ends ahead.
"It's an artifact of the model." It is the reverse. Feed the smooth average of that period into the standard retirement projection and the market-only plan looks superior. Feed in the real order of that identical average and the result inverts — the market-only plan fails while the coordinated one pays income for life and leaves $1.17M. The industry's own preferred model is the one in which sequence risk cannot appear, because it is built on a straight line. Run the analysis the industry does not run, and the conclusion turns over.
"A more careful withdrawal fixes it." It does not; it only hides it. A $2,000,000 household drawing a conservative 4.2% did not run out — and spent its entire retirement watching a falling account fund a rising share of its income, ending at $725,393 after a whole-plan return of 2.28%. Lowering the draw makes a household slower to fail and quieter about the risk it still carries. The exposure is structural at every withdrawal rate.
The Tax Machineand the Bet Beneath It
Sequence risk is the danger every retiree has at least heard named. The tax machine is the one almost none have, and it is the largest untapped differentiator in retirement income planning — because it does not exist during accumulation at all. A saver's tax life is simple: contribute, defer, ignore. A retiree's is the opposite, and beneath its gears sits a wager most savers never knew they placed.
The rate bet. Every 401(k), IRA, and 403(b) rests on one unstated premise: defer the tax now, at today's rate, and pay it later at a lower one. That is not a fact — it is a bet on a future tax rate the saver does not control — and the probable direction is not down. The federal debt has run from about $19 trillion to nearly $40 trillion in a decade; the annual interest on it now exceeds the entire defense budget; and Social Security, Medicare, and Medicaid keep compounding — pressures a government closes only three ways: cut spending, grow out, or raise taxes. Meanwhile today's top rate of 37% sits near a century's floor — it was 70% as recently as 1980, 91% through the 1950s, 94% during the war — freshly cut and locked in, with far more room above it than below. This brief predicts nothing; it notes only that betting a life's savings on rates staying this low is a wager against the likelier outcome, and the deferred saver has placed it whether or not anyone told them.
The defense is diversification across the three ways money is taxed — the same discipline a serious investor applies to holdings, applied to tax treatment:
- Tax-deferred (401(k), IRA, 403(b)) — pay later, at whatever rate is in force when you withdraw. The bucket that is the bet.
- Taxable (brokerage) — pay as you go, at capital-gains rates. Flexible, but inefficient as the dominant vehicle.
- Tax-free (Roth accounts and properly structured permanent life insurance) — pay up front, and every later withdrawal, structured correctly, arrives with no further federal income tax, no matter where rates have moved.
A household that holds all three does not have to guess which way Congress moves. A household that holds only the first has already made the guess.
More than owning all three buckets, the advantage is holding the right balance across them — and that balance is built with a runway. A household that positions its buckets in the years before retirement arrives with an income plan already coordinated for tax efficiency, instead of reacting to the machine one forced withdrawal at a time. And for the many readers already at the door of retirement or through it: it is never too late. Repositioning begun at sixty-seven or seventy still lowers the tax on the years ahead, still shrinks the forced-distribution problem before it compounds, and still moves income into the bucket the machine cannot reach. Tax efficiency is worth planning for now and for every year that follows.
The gears that do the taxing. On top of the rate bet run the mechanics, and each one bites harder the higher the rate turns out to be:
- The Social Security tax torpedo. Because a dollar of ordinary income can pull an extra fifty or eighty-five cents of Social Security into taxation with it, the true marginal rate is the bracket multiplied. A retiree who believes they are in the 12% bracket can face a real 18% or 22.2% on the next dollar; a 22% bracket can face 40.7%. The meter is running, and it is printed nowhere.
- The IRMAA cliffs. Cross a Medicare income threshold by a single dollar and the entire surcharge for that tier applies at once, to both spouses, on two premiums — well over a thousand dollars a year for that one dollar. And because IRMAA looks back two years, the bill lands in a year already lived and is difficult to undo.
- RMDs, and the heirs' version. Beginning at seventy-three, required minimum distributions force a rising share of every tax-deferred account out as ordinary income whether you need it or not — 3.8% of the balance at seventy-three, climbing past 11% by ninety-five. And the account does not stop being taxable at death: an heir must empty an inherited balance within ten years, taking distributions in their own peak earning years, likely at a higher rate than the parent ever paid. "Take only the minimum" does not solve the problem; it forwards it, enlarged.
- "Tax-free" is not "MAGI-free." The municipal bond sold as "tax-free" still counts, in full, toward the figures that trigger the torpedo and the IRMAA cliff. Only two income sources are genuinely invisible to those meters: qualified Roth distributions and income drawn properly from a properly structured whole life policy.
What "MAGI-invisible" is worth, in dollars. Put the whole machine on two households living the identical retirement. Each collects $50,000 of Social Security and wants $50,000 more to spend — the same $100,000 lifestyle. The only difference is where the extra $50,000 comes from.
| One $100,000 lifestyle, two sources | Market-only household | Coordinated household |
|---|---|---|
| Social Security | $50,000 | $50,000 |
| The other $50,000 drawn from | a traditional IRA (taxable) | properly structured policy income (not a taxable event) |
| Provisional income | $75,000 | $25,000 |
| Social Security pulled into tax | up to $42,500 | $0 |
| Taxable income created | ≈ $92,500 | $0 |
Same house, same trips, the same $100,000 spent — and one couple created $92,500 of taxable income and watched $42,500 of its Social Security dragged into tax, while the other created none and kept its Social Security whole. Neither earned a dollar more than the other.
The tax machine reads addresses, not lifestyles.
And that is the mechanism the Buffer quietly exploits every time it substitutes policy income for a portfolio draw.
What a coordinated plan does about it. It manages the machine on three levers a market-only plan does not have. The Firewall converts a slice of the tax-deferred balance into level lifetime income, ending the sequence-driven spikes that throw a household over a cliff — and, because it is qualified money, its payments satisfy the required distribution on the annuitized balance and can help satisfy it on the household's other IRA assets as well. The Buffer — properly structured policy income — is genuinely MAGI-invisible, a source that can be drawn in a high-income year without moving a single meter. And the coordinated plan fills the tax-free bucket on purpose: rather than wait for a low-income year a household needing $144,000 never gets, it runs Roth conversions deliberately in the early retirement years, filling the 22–24% bracket to move a decade of future income out of reach before rates, RMDs, and the torpedo can compound on it — mitigating tax-rate risk, and at the limit of a 0% bracket, eliminating it.
The Two Systems That Change the Answer
A market-only plan has no defense against any of this. A coordinated plan adds two, and they deploy on different timelines.
The Volatility Firewall — guaranteed income, and no runway required. The Firewall is lifetime income only an insurer can promise, because only an insurer pools mortality: the actuarial certainty that some members die early is what funds the payments of those who live long, and it is why a joint contract can pay 7.40% for life where no self-funded account safely can. Switch it on for the same couple at sixty-seven, and the identical $1,000,000 that ran dry at ninety instead pays $48,000 every year for as long as either spouse lives and leaves $1,169,122 to heirs — more income and more legacy, from the same starting balance, with the annuity bought at the door. It needs no runway: a reader already at retirement gets the larger of the two protections immediately. And "guaranteed" is used here in its strict sense — a contractual floor, not a hopeful adjective. There is a plainer name for the whole arrangement, and one most people already trust: a pension. A lifetime annuity is simply a pension a household builds for itself, now that few employers still hand one down — and no one ever called their pension a bad deal for "not getting it all back."
The Volatility Buffer — the protection that must be built. The Buffer is the non-correlated cash value of a properly structured whole life policy, drawn in the year after a market loss so the portfolio recovers on its full balance instead of a withdrawn-from one. That is the 24.7% problem defused — not by predicting the down year, which cannot be done, but by having somewhere else to draw from once it has happened. Unlike the Firewall, the Buffer must exist before it is needed, which is the one reason an accumulation-phase decision cannot be graded on an accumulation-phase rate of return: the cash value's job was never to out-earn the equity sleeve, but to exist — funded, liquid, uncorrelated — on the morning a decade later when the market falls in the second year of a retirement.
One clarification matters, because it is the objection that makes readers think they have missed their chance: the Buffer does not require a decade of runway. A properly structured policy reaches useful strength in about five to six years of funding, and that runway need not fall before retirement — only before the Buffer is needed. A household retiring in three years, with an income source covering its first three years, has those three years to build it. Nor is it age-gated the way intuition assumes: the build works well into a client's sixties in good health. The rule is not "start ten years early." It is "have it before the year after the loss."
The Coordinated Plan, in One Household
Meet Marcus and Elena Barrett, both sixty-seven, just retired, in good health. Their retirement has to produce $144,000 a year: a $108,000 baseline for the necessities, plus $36,000 of discretionary income for the things that make retirement worth reaching. Against that they hold $50,000 of Social Security and a $10,000 pension — $60,000 that arrives no matter what the market does — so their own savings must generate the other $84,000.
Read the whole case with one fact fixed: both roads save the identical amount every year. Rewind to fifty-seven, where the fork actually sits. The Barretts hold $645,000 in their combined 401(k)s and have already committed to saving $44,000 of their income a year, with a $12,000 employer match — $56,000 a year, the same on both roads. Nothing below asks them to give up a dollar of lifestyle. The only thing the fork decides is where that $44,000 goes, and how it is taxed on the way in.
On the Conventional road, all $44,000 goes into the 401(k)s pre-tax; with the match, $56,000 a year compounds to $2,000,000 by sixty-seven. They draw the full $84,000 their plan needs beyond Social Security and the pension — the same $2,000,000-at-4.2% run above: it survives, at a whole-plan 2.28%, ending at $725,393, every income dollar leaving a falling account along the way.
On the Coordinated road, the same $44,000 is split: $12,000 stays in the 401(k)s and $32,000 (taxed once at 25% on the way) funds a properly structured whole life policy. The 401(k)s reach $1,542,408, and the policy stands at a $281,114 cash value behind a $536,014 death benefit. The 401(k) is smaller by design, not by loss: the same dollars that would have swelled it further instead funded the policy standing beside it — and the household gave up nothing in lifestyle to do it. At retirement they build the Firewall: $487,000 rolled into a joint lifetime annuity paying $36,000 a year, guaranteed for both lives. Now the baseline assembles with zero market exposure — $50,000 Social Security, $10,000 pension, $36,000 annuity, and $12,000 of gross-equivalent tax-free policy income cover the $108,000 floor entirely by contract. Only the $36,000 discretionary is drawn from the market, from the $1,055,000 sleeve that remains — and it is drawn with the Buffer, which fires five times across the 2001–2025 window (each year after a loss), leaving the sleeve to recover untouched. It ends at $1,595,451 — plus the lifetime income and the death benefit, neither of which is in that figure. Move one decision earlier — pre-funding the Firewall at fifty-seven — and the sleeve ends at $1,822,959 instead, for no additional saving.
The Income-and-Legacy Scorecard
Score the cleanest case whole — the same $1,000,000 at sixty-seven — and the pattern behind every exhibit in the whitepaper appears in one table:
| The same $1,000,000 at 67, scored whole | Conventional (market-only) | Firewall at the door |
|---|---|---|
| Income delivered across the window | $1,133,599, then stops | $1,200,000, and never stops while either spouse lives |
| Years of income | 23 full, a partial 24th, then $0 | all 25 in-window, then income for life |
| Left to heirs at 91 | $0 | $1,169,122 |
| Baseline income exposed to the market | all of it | none |
| Whole-plan net internal rate of return | 1.04% | ≈ 5%, and rising every year lived past 91 |
The most surprising line is the legacy. The household that removed its income from the market did not sacrifice its estate to do so — it increased it, from $0 to $1,169,122 on an identical $1,000,000. The market did not have to earn more; the coordinated plan simply kept more of what it earned and never sold at the bottom to fund a paycheck.
Two refinements make the comparison fairer still, and both cut the coordinated plan's way. The gross is held equal; the spendable is not. Both plans are held to the same $144,000 of gross income, but the Conventional household's $144,000 is almost all ordinary, MAGI-counting income — it runs the whole tax machine and drags its Social Security into tax before a cent is spent. The coordinated household draws the same $144,000, but a large share arrives tax-free and invisible to the meters, so less of the identical gross is taxable and more of it is actually spendable. And the $36,000 discretionary already carries inflation: read it not as a fixed lifestyle but as the twenty-five-year average of a need that starts near $25,000 and rises 3% a year to just over $50,000 by year twenty-five. The flat $36,000 is the inflation-adjusted average, used level only for comparative simplicity.
Inflation, and the Level Number
A guaranteed income invites one obvious objection: a level payment loses purchasing power every year it stays level. At 3% inflation, the Firewall's $48,000 spends like roughly $22,900 in today's money after twenty-five years. That erosion is real — and if the annuity were the entire plan, the objection would be fatal. It is not. The coordinated plan does not assign inflation to the guaranteed sleeve. The largest piece of the baseline, Social Security, already indexes by law; the market sleeve and the growing policy carry the raise; and equities are the one asset that has historically outrun inflation over long horizons — which is exactly why the plan keeps a growth sleeve whose entire job is to. A cost-of-living rider on the annuity exists, but it usually surrenders a quarter to a third of the starting income to buy the increase — often a poor trade. The market-only plan, by contrast, has no floor at all: its answer to inflation is to hope the same volatile sequence that emptied the account also outruns prices while it is being drawn down. The coordinated plan does not hope. It assigns inflation to the asset built to beat it and certainty to the asset built to provide it.
The Two Fears
There are only two ways for the money to fail a life, and every retiree knows both without being taught: that you live longer than it lasts, or that you go too soon and leave less than you meant to. Almost every product asks you to insure against one by betting against the other — buy the lifetime income and you have bet on living long; buy the death benefit and you have bet on going early. The coordinated plan already holds both, and they are not two bets. They are two halves of a single hedge on the same variable — how long you live. The annuity's return is lowest if you die early and climbs the longer you live; the policy's is highest if you die early and falls the longer you live. Held together, they cancel: die early and the death benefit lands at its peak; live long and the annuity pays income that cannot be outlived.
The household's own timing — the one thing it cannot know or control — stops deciding its financial outcome.
That is why "guaranteed" is an earned word here: the risk was removed, not bet.
What the Usual Objections Get Wrong
- "You lose the money to the insurer." Only if the annuity is held alone. In a coordinated plan it is paired with the death benefit, so the estate is not forfeited to secure the income — and the alternative the objection prefers is the plan that left $0 at ninety.
- "Mortality credits are just my own money back." No — a self-funded account cannot sustain a 7.40% lifetime payout across an unknown lifespan. The excess comes from the pool, from a risk an insurer can carry and an individual cannot.
- "I can self-insure with a bond ladder." A ladder must be sized for the longest plausible life and still fails if you outlive it, because a portfolio of your own bonds cannot pool mortality. A ladder is a fine tool for a defined horizon; a lifetime is not one.
- "Whole life is a poor investment." This brief does not argue whole life as an investment or on rate. Its role here is the Buffer — a non-correlated reserve that lets the portfolio recover untouched — and, as the companion series documents, as a replacement for the safe sleeve a plan already holds.
What This Brief Is Not Arguing
It is not arguing against the market. Every plan here keeps a market sleeve, because growth is a real and necessary engine that carries the discretionary income and much of the legacy. What the coordinated plan refuses to do is ask the market to guarantee a paycheck — a job it was never built to do. It is not a claim that whole life out-earns equities; it does not, and it is not asked to. And it is not a forecast: no crash is predicted anywhere. Every severe year in these pages is a real historical one, inside a traced sequence. The argument is only that the order of returns is decisive once the income years begin, and that a plan built for that order beats one extended into it on autopilot — on income, on taxes, on legacy, and on the two fears a retirement is actually lived on.
Where to Begin
If you want the full derivation — the traced ledgers, the six start-year record, the tax machine worked in dollars, the anticipated critiques answered in full — that is the deep analysis this brief is drawn from: Distribution: The Order of Things.
If you would rather start with your own numbers, that is a Retirement Income Diagnostic: a focused look at how your plan is actually arranged — whether your income, your sequence exposure, your tax picture, and your legacy are working as one system or simply sitting side by side. You leave knowing where your seams are, whether or not you do anything about them. What it produces is a coordinated Retirement Income Plan — principles first, then strategy, then whatever instruments the plan actually calls for, with one person designing for the total.